I recently moved my existing esxi hypervisors to ProxMox to have more control then the esxi shell allowed. This allows me to run puppet natively on the hyper visor host. As part of this upgrade I installed an old SSD and ram into my 2011 Mac Mini. While doing so I broke the small traces that attach the cooling fan. After some research I found many people have done the same and just leave it fanless. This presented me with a great opportunity to graph the the various temp sensors as I tried different cooling methods.
| Software | Version | OS |
|---|---|---|
| puppet | 6.21.0 | Debian |
| Debian | 10.7 | buster |
Puppetfile
mod 'graphite',
  :git => 'git@github.com:echocat/puppet-graphite.git',
  :ref => 'v8.0.0'

mod 'grafana',
  :git => 'git@github.com:echocat/puppet-grafana.git',
  :ref => 'v1.2.0'

mod 'elasticsearch',
  :git => 'https://github.com/elasticsearch/puppet-elasticsearch.git',
  :ref => '7.0.0'

mod 'elastic_stack',
  :git => 'https://github.com/elastic/puppet-elastic-stack.git',
  :ref => '7.0.0'

mod 'apache',
  :git => 'https://github.com/puppetlabs/puppetlabs-apache',
  :ref => '1.5.0'

mod 'collectd',
  :git => 'git@github.com:pdxcat/puppet-module-collectd.git',
  :ref => 'v12.2.0'
New to puppet? Checkout my how to on installing a
puppetserver
We can install the packages needed for graphite to configure and store data.
Installing Graphite
package{ 'graphite-carbon':
  ensure => 'present',
}

class { 'graphite':
    gr_apache_24               => true,
    gr_web_cors_allow_from_all => true,
    secret_key                 => '$uper$ecret?',
    gr_web_server           => 'none',
    gr_web_user             => 'www-data',
    gr_web_group             => 'www-data',
    gr_disable_webapp_cache => true,
    gr_storage_schemas      => [
    {
      name       => 'carbon',
      pattern    => '^carbon\.',
      retentions => '1m:90d'
    },
    {
      name       => 'default',
      pattern    => '.*',
      retentions => '1m:30m,1m:1d,5m:2y'
    },
    {
      name       => 'collectd',
      pattern    => '^collectd.*',
      retentions => '1m:30m,1m:1d,5m:2y'
    }
  ],
  }
Here we can install Graphite and configure it with a storage scheme for collectd. The important bits here are gr_web_server => 'none', which allows us to configure graphite to be hosted with apache.
Setting up a Webserver
As both Graphite and Grafana can use apache lets start with a default installation.
include '::apache'
package {'libffi-dev':
  ensure => 'present',
}
Setting up Graphite Vhost
Once apache is running we can setup a vhost for Graphite as follows
apache::vhost { "graphite.${::domain}":
    port    => '80',
    docroot => '/opt/graphite/webapp',
    wsgi_application_group      => '%{GLOBAL}',
    wsgi_daemon_process         => 'graphite',
    wsgi_daemon_process_options => {
      processes          => '5',
      threads            => '5',
      display-name       => '%{GROUP}',
      inactivity-timeout => '120',
    },
    wsgi_import_script          => '/opt/graphite/conf/graphite.wsgi',
    wsgi_import_script_options  => {
      process-group     => 'graphite',
      application-group => '%{GLOBAL}'
    },
    aliases => [
         {
           alias            => '/content/',
           path             => '/opt/graphite/webapp/content/',
         },
         {
           alias            => '/static/',
           path             => '/opt/graphite/static/',
         },
   ],
    wsgi_process_group          => 'graphite',
    wsgi_script_aliases         => {
      '/' => '/opt/graphite/conf/graphite.wsgi'
    },
    headers => [
      'set Access-Control-Allow-Origin "*"',
      'set Access-Control-Allow-Methods "GET, OPTIONS, POST"',
      'set Access-Control-Allow-Headers "origin, authorization, accept"',
    ],
    directories => [
      {
        path => '/media/',
        order => 'deny,allow',
        allow => 'from all'
      },
      {
        path => '/opt/graphite/static/',
        order => 'deny,allow',
        allow => 'from all'
      },
      {
        path => '/opt/graphite/webapp/content/',
        order => 'deny,allow',
        allow => 'from all'
      },
    ]
  }
This is more or less the example in the modules README with a small tweak:
...
{
  alias            => '/static/',
  path             => '/opt/graphite/static/',
},
...
This undocumented line is the most important as otherwise you are greeted with a blank site with only headers.
  file {"/opt/graphite/conf/graphite.wsgi":
    ensure => 'present',
    source => "/opt/graphite/conf/graphite.wsgi.example"
  }
We now can copy the example .wsgi file
Setup
We now need to init the graphite django configuration. I should show you how to do this with an exec here, but honestly I often do this manually on first build with the following commands
sudo -H PYTHONPATH=/opt/graphite/webapp django-admin.py migrate --settings=graphite.settings --run-syncdb
sudo -H PYTHONPATH=/opt/graphite/webapp django-admin.py createsuperuser --settings=graphite.settings
sudo -H PYTHONPATH=/opt/graphite/webapp django-admin.py collectstatic --noinput --settings=graphite.settings
You should be able to verify the installation by sending some example metrics too it:
PORT=2003
SERVER=graphite.homeops.tech
echo "local.random.diceroll 4 `date +%s`" | nc -q0 ${SERVER} ${PORT}
Installing ElasticSearch
To store the graphs in grafana we need an elasticsearch deployment. I actually don’t use this as I normally export the json and have puppet manage it so it can be redeployed at will. The following however is an example of getting elasticsearch up and running.
class {'elasticsearch':
  config       => {
    'cluster.name'           => 'elk',
    'node.name'              => $::fqdn,
    'network.host'           => '0.0.0.0',
    'discovery.type'         => 'single-node',
    'http.cors.allow-origin' => '*',
    'http.cors.enabled'      => 'true',
    'xpack.security.enabled' => 'false',
    'xpack.ml.enabled'       => 'false',
    'node.master' => 'true',
    'node.data' => true,
    'node.ingest' => true,
    'action.auto_create_index' => true,
  },
  restart_on_change => true,
  manage_repo  => true,
  init_defaults => {
      'ES_USER' => 'elasticsearch',
      'ES_GROUP' => 'elasticsearch',
      'MAX_OPEN_FILES' => '65535',
      'MAX_LOCKED_MEMORY' => 'unlimited',
      'JAVA_HOME' => '/usr',
      },
}

es_instance_conn_validator { 'elk' :
  server => 'localhost',
  port   => '9200',
}
I use this elasticsearch for an ELK stack (look forward a future article!) so thats why I call it elk here.
You should be able to verify the installation with the following:
curl -X GET "localhost:9200/_cluster/health?wait_for_status=yellow&timeout=50s&pretty"
{
  "cluster_name" : "elk",
  "status" : "yellow",
  "timed_out" : false,
  "number_of_nodes" : 1,
  "number_of_data_nodes" : 1,
  "active_primary_shards" : 7,
  "active_shards" : 7,
  "relocating_shards" : 0,
  "initializing_shards" : 0,
  "unassigned_shards" : 1,
  "delayed_unassigned_shards" : 0,
  "number_of_pending_tasks" : 0,
  "number_of_in_flight_fetch" : 0,
  "task_max_waiting_in_queue_millis" : 0,
  "active_shards_percent_as_number" : 87.5
}
Single shard deployments will show yellow not green/
Installing Grafana
class {'grafana':
  graphite_host      => "graphite.${::domain}",
  elasticsearch_host => "localhost",
  elasticsearch_port => 9200,
}
I’m using an older version of grafana as I have some older dashboards I don’t want to update.
Dashboards
# Collectd Dashboard
file {'/opt/grafana/app/dashboards/':
  ensure  =>  directory,
  source  => 'puppet:///modules/profile/grafana/',
  recurse => true,
}
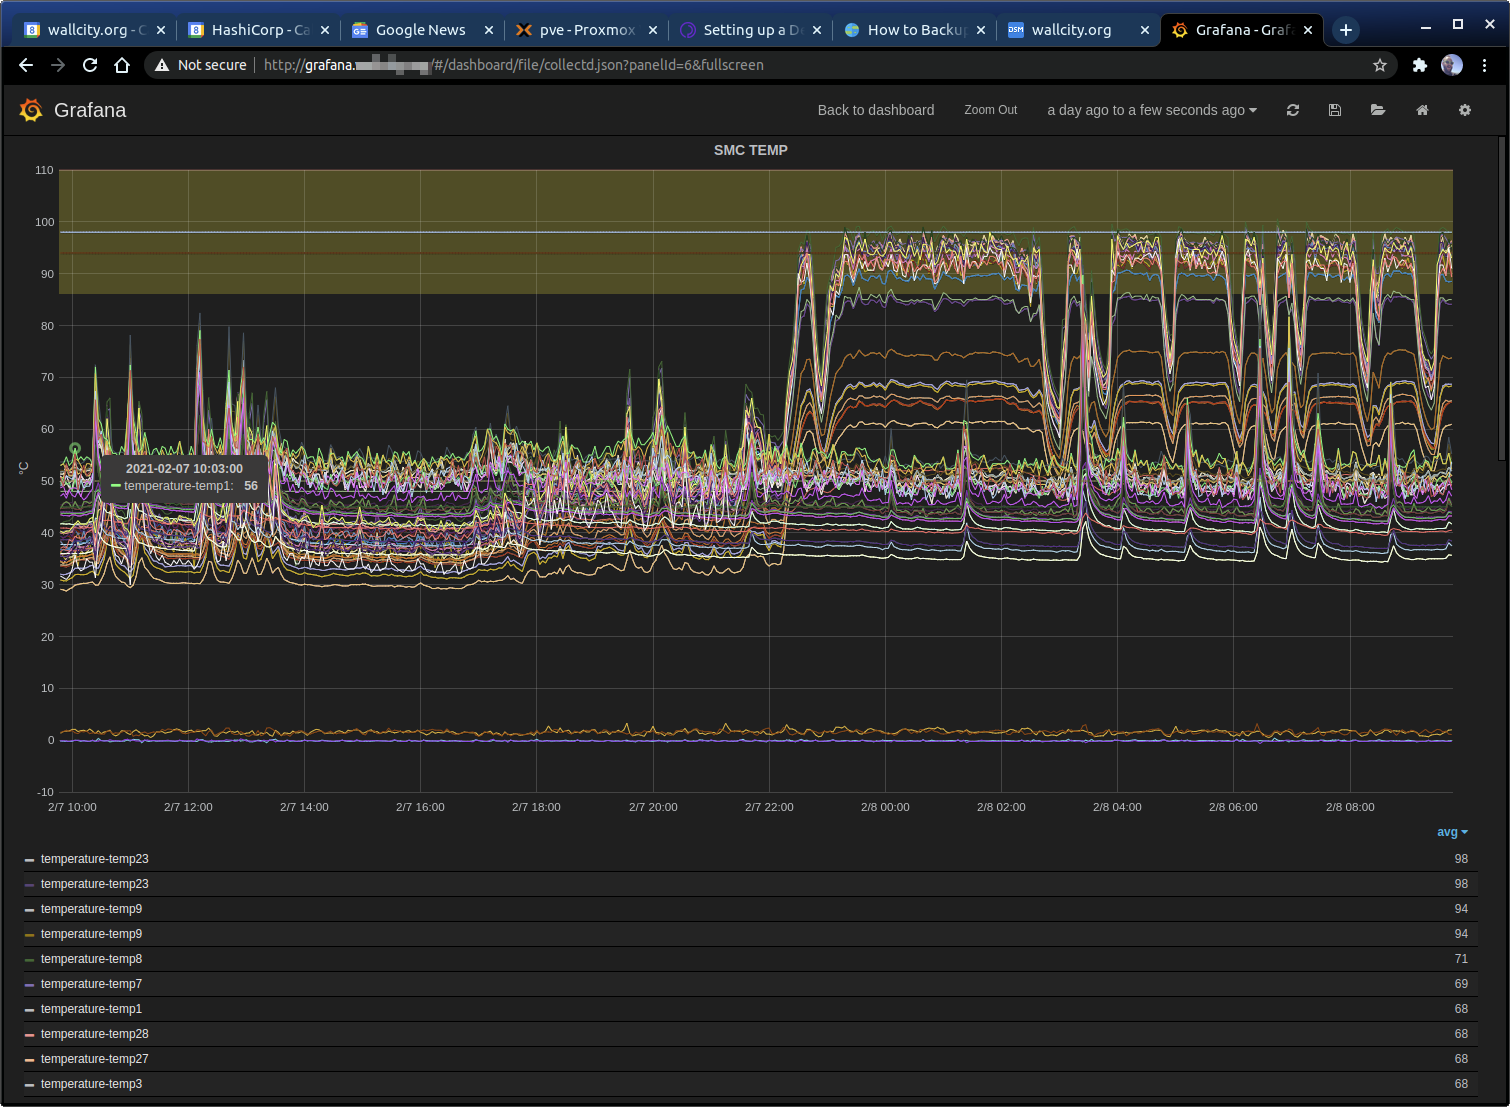
As mentioned, while its neat that grafana can store its data in ElasticSearch. I don’t actually use that. When I build a dashboard I export it and save it in the profile/files/grafana directory of my module. This the is recusively copied into grafana’s web directory. This means when I build or rebuild my grafana deployments I don’t have to import elasticsearch data. It also means I can use templates to build dynamic dashboards that are copied in to /opt/grafana/app/dashboards/. These are then available using the following URL e.g. for collectd.json : http://grafana.homeops.tech/#/dashboard/file/collectd.json
Setting up collectd
As I mentioned I wanted to monitor the temperature of the 2011 mac mini server I use as the Proxmox virtualisation box. Its my backup box and so I wanted to see if any of the USB fans I had laying around the house would actually work to cool it. To start graphing the temperature I needed to use the sensors package on debian/proxmox.
This is as simple as appling this configuration to that node:
class {'collectd::plugin::sensors':
  manage_package => true,
}
This installs the sensors package. I also for good measure (and maybe required) ran the following to detect all sensors on the system.
sudo sensors-detect
sudo sensors
coretemp-isa-0000
Adapter: ISA adapter
Package id 0:  +53.0°C  (high = +86.0°C, crit = +100.0°C)
Core 0:        +51.0°C  (high = +86.0°C, crit = +100.0°C)
Core 1:        +53.0°C  (high = +86.0°C, crit = +100.0°C)
Core 2:        +46.0°C  (high = +86.0°C, crit = +100.0°C)
Core 3:        +49.0°C  (high = +86.0°C, crit = +100.0°C)
...
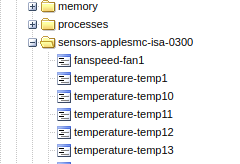
I was pleasantly surprised to find most supported by the package.
While collectd doesn’t resolve them , a long term plan is to rewrite the json using this table.
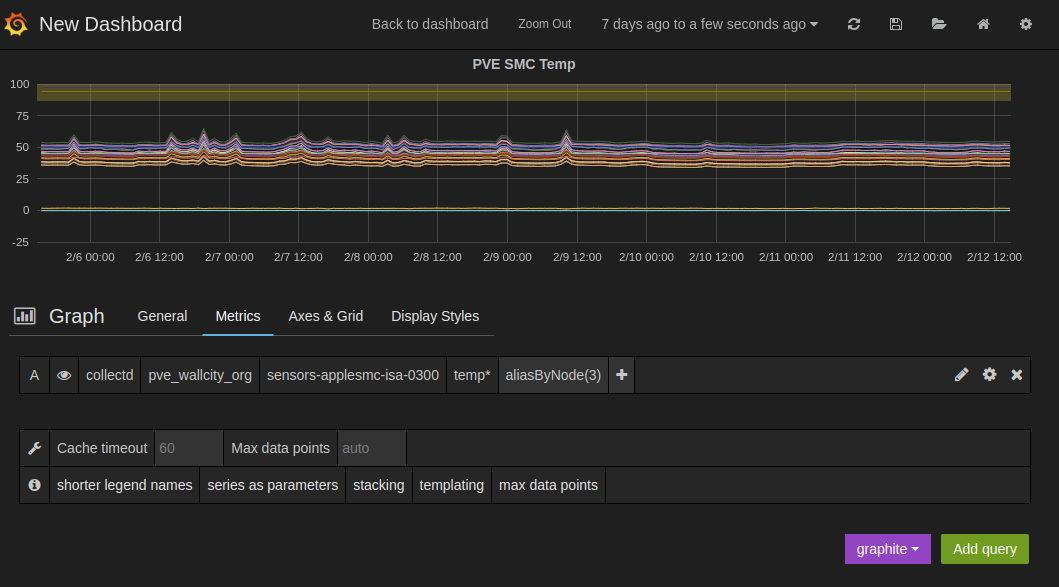
Create the dashboard is simple as creating a dynamic entry for the node as show above.

As luck would have it the only USB fans I had was a gift that someone gave me years ago. It was a LED fan that I had since lost the windows-only install CD for. Given the state of the mini it seemed appropriate.
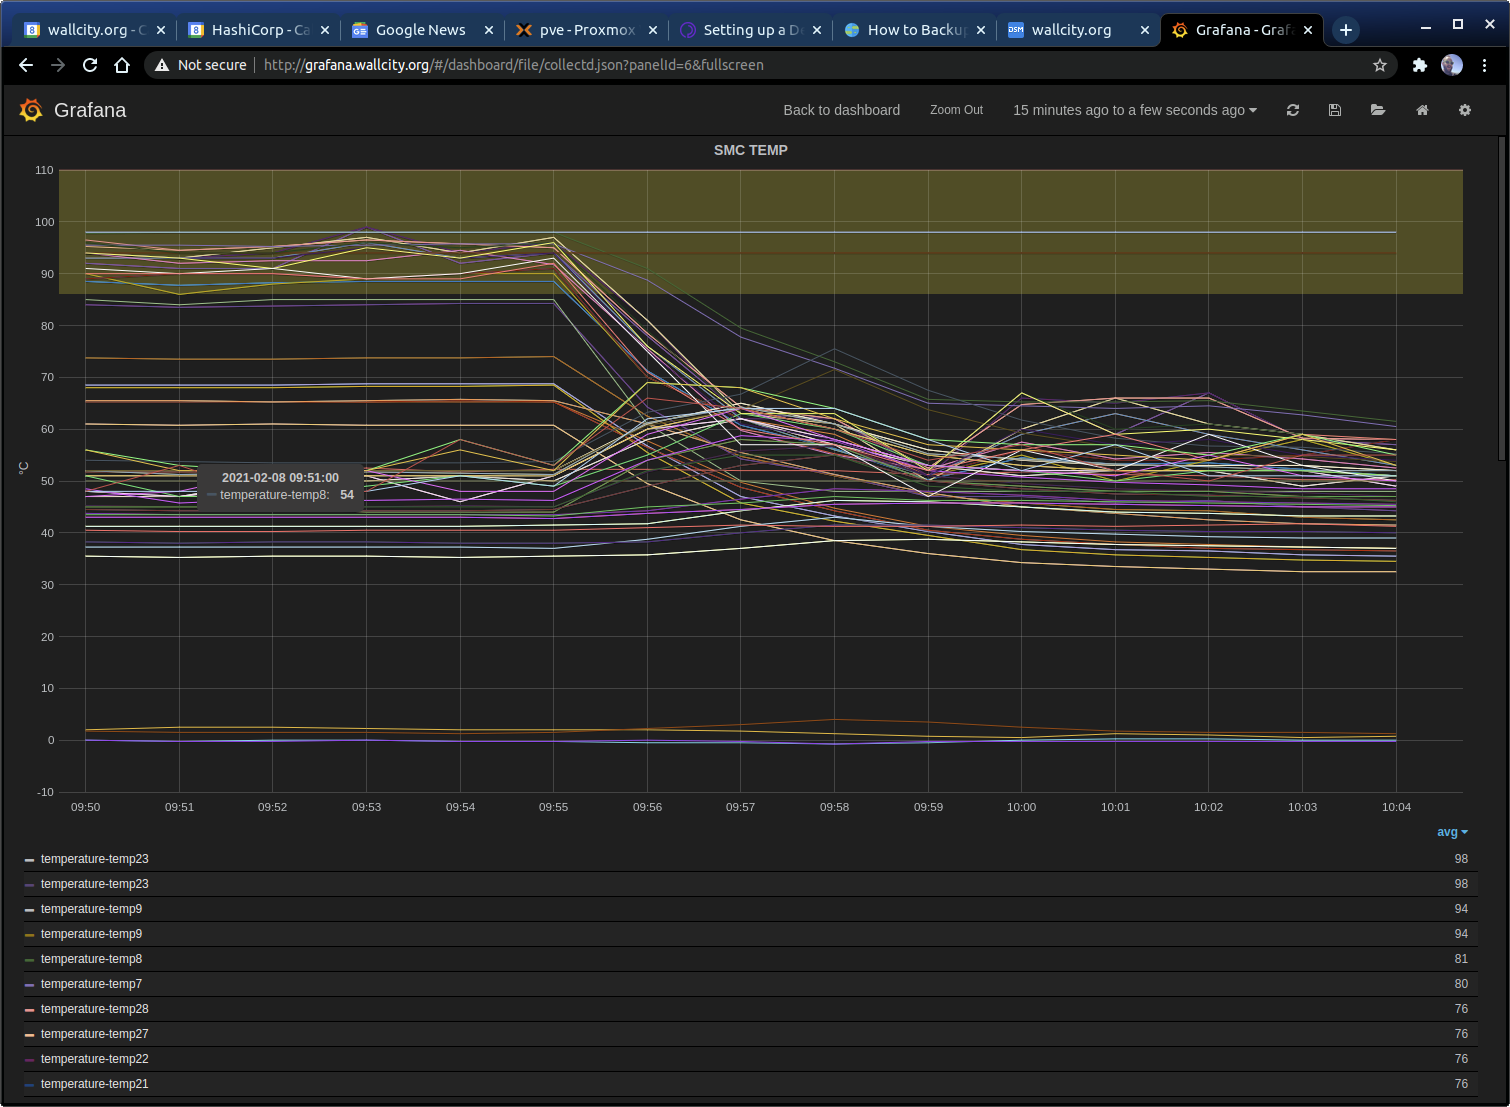
Interestingly enough even at high load the fan managed to cool the SMC temp sensors ( and the CPU sensors) below the high/crit values.
Suffice to say I have replacement server (intel NUC) on order , however I may keep this mini around given its working. Proxmox supports a cluster with my APC PDU where it would only power on in the event of failure.
I’ll write that up if I get it working.
Comments